Data Analytics Course

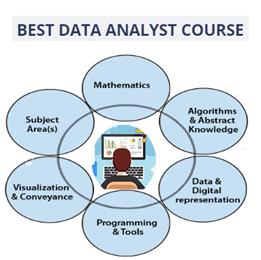
This Data Analytics course is designed to equip learners with the skills and knowledge required to analyze, interpret, and visualize data for informed decision-making. The course covers foundational to advanced data analysis techniques using tools like Excel, SQL, Power BI, and Python. Whether you’re a student, job seeker, or working professional, this course will help you build a strong career in the data-driven world.
Duration: 3 to 6 Months
Eligibility: Basic computer knowledge
Mode: Online / Offline
Tools Covered: Excel, SQL, Power BI, Python, Pandas, Matplotlib
Module 1: Introduction to Data Analytics
What is Data Analytics?
Types of Analytics: Descriptive, Diagnostic, Predictive, Prescriptive
Data-Driven Decision Making
Roles & Responsibilities of a Data Analyst
Career Opportunities
Module 2: Data Handling with Excel
Data Cleaning and Formatting
Advanced Excel Functions (VLOOKUP, INDEX-MATCH, IFs)
Pivot Tables and Charts
Conditional Formatting
Basic Dashboard Design
Module 3: Database Management with SQL
Introduction to Databases & RDBMS
SQL Basics: SELECT, WHERE, ORDER BY
Joins: INNER, LEFT, RIGHT, FULL
Grouping and Aggregation (GROUP BY, HAVING)
Subqueries and Views
Working with Real Datasets
Module 4: Data Visualization with Power BI
Introduction to Power BI Interface
Importing Data and Data Modeling
Creating Interactive Reports and Dashboards
Using DAX Functions for Calculations
Publishing and Sharing Reports
Module 5: Data Analysis with Python
Python Basics for Analytics: Variables, Lists, Functions, Loops
Data Handling with Pandas
Data Cleaning Techniques
Data Visualization with Matplotlib and Seaborn
Basic Data Exploration and Summary Statistics
Module 6: Real-World Projects & Case Studies
Sales Data Analysis
Customer Segmentation
Employee Performance Dashboard
Financial Data Reporting
Healthcare Data Insights
Additional Topics
Introduction to Business Intelligence (BI)
Understanding KPIs and Metrics
Report Automation Basics
Resume Building and GitHub Profile Setup
Interview Preparation (Q&A Sessions and Mock Interviews)
Key Highlights:
Practical Training with Real Datasets
Hands-On Projects and Assignments
Certification on Completion
Job-Oriented Curriculum
Career and Freelance Guidance
Career Opportunities After Course Completion:
Data Analyst
Business Analyst
MIS Executive
Reporting Analyst
Data Visualization Specialist
Junior Data Scientist
This course is perfect for beginners who want to start a career in data analytics, professionals looking to upgrade their skills, or business owners aiming to make data-driven decisions. With practical tools and live projects, students will gain the ability to turn raw data into valuable insights.
Book Free Demo Class Now!
What You Will Learn?
Fundamentals of Data Analytics – Understand the types of analytics (descriptive, diagnostic, predictive, prescriptive) and how data supports decision-making.
Data Cleaning & Preparation – Learn techniques to clean, structure, and format raw data for analysis.
Advanced Excel Skills – Use functions like VLOOKUP, INDEX-MATCH, Pivot Tables, Charts, and Dashboards for data analysis.
SQL for Data Retrieval – Write SQL queries to fetch, filter, sort, join, and aggregate data from databases.
Data Modeling – Learn how to organize and relate data efficiently for analysis using Power BI and SQL.
Power BI Dashboards – Create interactive dashboards, reports, and visualizations using Power BI.
DAX (Data Analysis Expressions) – Use formulas and functions in Power BI for custom metrics and advanced calculations.
Python Programming Basics – Understand Python syntax, variables, loops, functions, and use it for data analysis tasks.
Data Analysis with Pandas – Load, manipulate, and analyze datasets using the Pandas library in Python.
Data Visualization with Python – Use Matplotlib and Seaborn to create charts and graphs for visual insights.
Exploratory Data Analysis (EDA) – Discover patterns, trends, and outliers in datasets using summary statistics and visual tools.
Real-World Projects – Work on case studies like sales reporting, customer behavior analysis, and employee performance.
Understanding KPIs and Metrics – Learn how to identify and track key business performance indicators.
Report Automation – Automate repetitive reporting tasks using tools like Excel Macros, Power BI scheduling, or Python scripts.
Career Preparation – Build a resume, create a GitHub project portfolio, and practice with mock interviews for data analytics roles.

